Chicago 2016 Food Inspections
In 2016, the state of Chicago inspected 144,003 different places that were serving food. Of these 144,003 different places, there were 442 different facility types. These included grocery stores, restaurants, school cafeterias, bars, and many more different kinds of facilities. Upon inspecting the food inspection data further, however, there were a lot of repeated facility types that would be counted as two “different” places when in reality they were the same type of facility. For example, one type would be listed as “School” while another listed as “SCHOOL”. This would cause School and SCHOOL to be incorrectly listed as two different facility types, likely driving up the number of different facility types inspected up to 442. Because of this, I suspected that the true number of different inspected facility types was closer to 400. After running the ‘toupper’ function on the facility types, the types were reduced down to 394 different facilities. This is likely much closer than the first number, however is still probably a bit too high of a number.
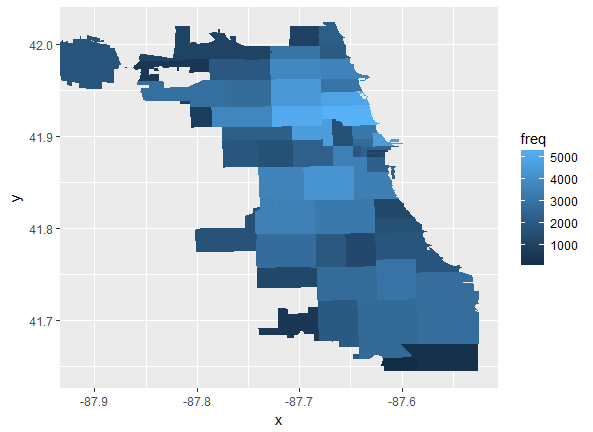
In the above photo, you can easily see the location of where facilities were inspected the most in Chicago. This image shows that most inspected places were in the south most part of Chicago.
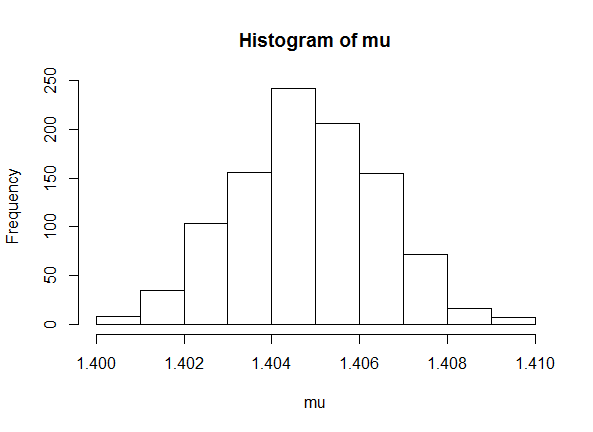
In the food inspections, facilities were rated on their risk levels. A risk level rating of 1 meant they were at high risk, while a risk level rating of 3 meant that they were at low risk. The average overall risk level of all the facilities in Chicago was around a 1.4, which means that most of the places are at a high risk and scored poorly on their health inspection.
There are quite a few different zip codes in Chicago, and I was curious to see if there was a correlation between the risk level and where the facilities were located.
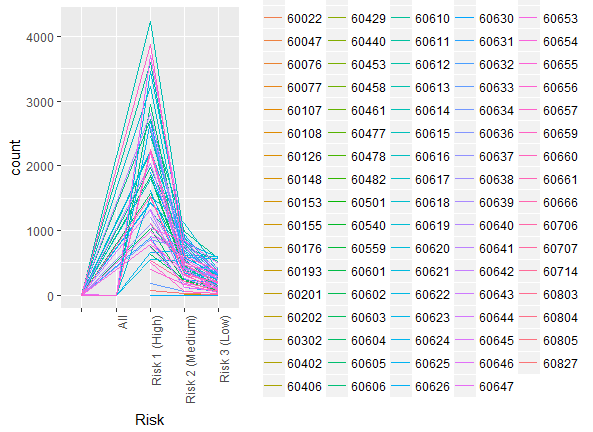
Here you can see… Not much. Most of the high risk areas seem to be around the 60610 zip code, however they are all squished together so much it is hard to tell.
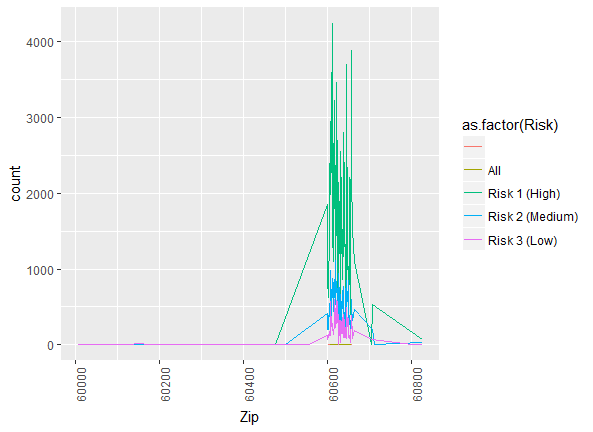
Here is a different way to look at it, and it is easier to see where the high risk zip codes are. They start popping up just around zip code 60500, and really ramp up around zip code 60600. This also shows where the low risk facilities were located by zip code, and as you can see it seems like they were in the very same areas where the high risk facilities were located! Because of this, I don't feel comfortable jumping to any conclusions about a correlation between facility type and where it was located by zip code.